
홍동이의 성장일기
[👩💻TIL 43일차 ] 유데미 스타터스 취업 부트캠프 4기 본문

[시험 5]
- When you drag additional tables to the logical layer canvas, Tableau automatically attempts to create the relationship based on existing key constraints and matching fields to define the relationship. If it can't determine the matching fields, then relating these tables is not possible.
추가 테이블을 논리 계층 캔버스로 끌면 Tableau는 기존 키 제약 조건과 일치하는 필드를 기반으로 관계를 자동으로 생성하여 관계를 정의합니다. 일치하는 필드를 확인할 수 없는 경우 이러한 테이블을 연관시킬 수 없습니다.
➡️ False - When relating tables, the fields that define the relationships must have the same data type.
테이블을 연결할 때 관계를 정의하는 필드의 데이터 유형은 동일해야 합니다.
➡️ True - Which of the following are required to create a trend line?
➡️ 2 measures on opposing axes, or a date and a measure on opposing axes. - Which of the following are true about joins?
- May drop unmatched measure values
- They are displayed with Venn diagram icons between physical tables
- When working with Excel, text file data, JSON file, pdf file data, you can use Wildcard Search to union files across folders, and worksheets across workbooks. Search is scoped to the selected connection.
Excel, 텍스트 파일 데이터, JSON 파일, pdf 파일 데이터로 작업할 때 와일드카드 검색을 사용하여 폴더 간에 파일을 결합하고 워크북 간에 워크시트를 결합할 수 있습니다. 검색 범위가 선택한 연결로 지정됩니다. - The row and column shelves contain Pills.
- You can create aliases for members in a dimension so that their labels appear differently in the view.
레이블이 보기에 다르게 나타나도록 차원의 구성원에 대한 별칭을 만들 수 있습니다. - Tableau Packaged Workbook (.twbx) contains the visualisations, info needed to build the visualisations, and a copy of the data source.
Tableau Packaged Workbook(.twbx)에는 시각화, 시각화 구축에 필요한 정보 및 데이터 원본 복사본이 포함되어 있습니다. - Tableau Public is hosted by Tableau to share our visualisations publically with the world.
Tableau Public은 당사의 시각화를 전 세계와 공개적으로 공유하기 위해 Tableau가 주최합니다. - Which of the following are valid options to define the scope of a reference line?
다음 중 기준선의 범위를 정의하는 데 유효한 옵션은 무엇입니까?
➡️ Cell, Pane(패널), Table

- Which of the following 2 fields cannot be deleted in Tableau?
➡️ Measure Values, Measure Names - You can union your data to combine two or more tables by appending values (rows) from one table to another.
표 간에 값(행)을 추가하여 데이터를 결합하여 둘 이상의 표를 결합할 수 있습니다.
질문: 3, 5
[시험 1 - 이어서]
- When you want to first apply a filter and then show the Top N or Bottom N elements, which of the following filters would you use?
필터를 먼저 적용한 다음 상위 N 또는 하위 N 요소를 표시하려면 다음 중 어떤 필터를 사용하시겠습니까?
➡️ Context Filter - It is possible to use measures in the same view multiple times (ex. sum of the measure and avg of the measure)?
동일한 보기에서 측정값을 여러 번 사용할 수 있습니까(예: 측정값의 합계와 측정값의 평균)?
➡️ Yes - For Bullet Graphs we need at least 2 measures

- We can join a maximum of 32 tables in Tableau
- Data granularity refers to the level of detail for a piece of data, whatever you are looking.
데이터 세분성은 현재 보고 있는 데이터에 대한 세부 수준을 나타냅니다. - The default path for all supporting files, data sources, icons, logs etc is in Documents → My Tableau Repository
모든 지원 파일, 데이터 소스, 아이콘, 로그 등의 기본 경로는 다음과 같습니다 Documents → My Tableau Repository

- Bins can be created on dimensions
빈은 차원에 생성된다.
➡️ True

- Dimensions containing Boolean and String values cannot be continuous.
부울 값과 문자열 값을 포함하는 차원은 연속형일 수 없습니다.
※ Date and Time은 가능 - If you decide you want to see all of the marks in the view at the most detailed level of granularity, you can disaggregate the measures the view.
보기의 모든 표시를 가장 세부적인 수준으로 표시하려면 보기의 측정값을 세분화할 수 있습니다.
[족보]
- Which of the following is the best reason to use a relationship instead a join?
You wish to avoid data duplication when combining tables with different granularity
세분성이 다른 테이블을 결합할 때 데이터 중복을 방지하고자 하는 경우 - Relationships are created in which layer?
어떤 계층에서 관계가 생성됩니까?
➡️ The logical layer - Which of the following is the best reason to create a saved data source as a .TDS file
다음 중 .TDS 파일로 저장된 데이터 원본을 생성하는 가장 좋은 이유는 무엇입니까
➡️ You want to save the default field properties such as number formats and sort order.
숫자 형식 및 정렬 순서와 같은 기본 필드 속성을 저장하려고 합니다. - When creating a union between tables what will happen if the field names do not match?
테이블 간에 유니언을 만들 때 필드 이름이 일치하지 않으면 어떻게 됩니까?
➡️ Fields in the union that do not have matching field names will contain null values.
일치하는 필드 이름이 없는 유니언의 필드에는 null 값이 포함됩니다. - In which of the following situations would an outer join be preferred to a blend?
다음 중 blend보다 outer join을 선호하는 경우는 무엇입니까?
➡️ when you need to include all rows from both tables, even when the join or blend criteria is not met
결합 또는 혼합 기준이 충족되지 않은 경우에도 두 표의 모든 행을 포함해야 하는 경우 - Which of the following uses a primary and secondary data source?
다음 중 Primary 및 Secondary 데이터 소스를 사용하는 것은 무엇입니까?
➡️ Blending - Which of the following can be renamed?
➡️ Field names, Parameters, Sets - Which of the following can have an alias?
다음 중 별칭을 가질 수 있는 항목은 무엇입니까?
➡️ Values of a discrete dimensions
이산 차원의 값 - Which of the following are predefined geographic roles?
다음 중 사전 정의된 지리적 역할은 무엇입니까?
➡️ Airport, Zip code - Which of the following are default properties which can be assigned to a dimension?
다음 중 차원에 할당할 수 있는 기본 속성은 무엇입니까?
➡️ Shape, Color, Sort - You would like to create a view showing the top 5 products by sum of sales for a given state or states. A set is used to select the top 5 products by sales. What type of filter should be used with state?
특정 주 또는 주에 대한 매출 합계별 상위 5개 제품을 보여주는 뷰를 생성하려고 합니다. 집합을 사용하여 매출 상위 5개 제품을 선택했습니다. 주에 어떤 유형의 필터를 사용해야 합니까?
➡️ Context Filter - Bins can be created for which type of field?
어떤 유형의 필드에 대해 빈을 만들 수 있습니까?
➡️ Continuous measure - Which feature would be most helpful in combining all values of a field containing a given string?
주어진 문자열을 포함하는 필드의 모든 값을 결합하는 데 가장 유용한 기능은 무엇입니까?
➡️ Group - What steps would you follow to create a cumulative sum of the values shown in the view?
뷰에 표시된 값의 누적 합계를 만들려면 어떤 단계를 수행하시겠습니까?
➡️ Right-click the pill for the measures in the view, select quick table calculation and then select "running total" - In which case would you most likely want to use a parameter?
매개 변수를 사용할 가능성이 가장 높은 경우는 무엇입니까?
➡️ To allow the viewer to select which measure to show in a bar chart
막대 차트에 표시할 측정값을 뷰어가 선택할 수 있도록 하는 방법 - The most important items on a dashboard should be positioned where?
➡️ Upper Left - You have dashboard and you want to add a feature so that selecting an element on one of the worksheets on the dashboard causes a change on another worksheet in the same dashboard. What features will do this?
대시보드가 있는 경우 대시보드의 워크시트 중 하나에서 요소를 선택하면 동일한 대시보드의 다른 워크시트가 변경되도록 기능을 추가하려고 합니다. 어떤 기능이 이를 수행합니까?
Filter Action, Highlight Action - Which of the following functions can be used on string to create a measure?
다음 중 문자열에서 측정값을 만드는 데 사용할 수 있는 기능은 무엇입니까?
COUNTD - [Use color from the marks card] If a continuous measure with all positive values is added to the Color area of the Marks card, what is the default
[마크 카드의 색상 사용] 모든 양의 값을 가진 연속 측정이 마크 카드의 Color(색상) 영역에 추가되는 경우 기본값은 무엇입니까?
A sequential color gradient
순차적인 색상 그라데이션
질문: 5, 9, 10
[시험 2-1]
- Which of the following are correct ways to define a join in Tableau version 2020.3 and above?
다음 중 Tableau 버전 2020.3 이상에서 조인을 정의하는 올바른 방법은 무엇입니까?
- Double-click a logical table to go to the Join/Union canvas in the physical layer and add joins or unions.
논리 테이블을 두 번 클릭하여 물리적 계층의 가입/결합 캔버스로 이동하고 조인 또는 결합을 추가합니다. - Right-click a logical table and click on open to go to the Join/Union canvas in the physical layer and add joins or unions.
논리 테이블을 마우스 오른쪽 버튼으로 클릭하고 열기를 클릭하여 물리적 계층의 가입/연합 캔버스로 이동하고 조인 또는 결합을 추가합니다.
- Double-click a logical table to go to the Join/Union canvas in the physical layer and add joins or unions.
- Which of the following are valid ways of Grouping Data?
다음 중 데이터를 그룹화하는 데 유효한 방법은 무엇입니까?
- From the Dimensions Shelf
- Using Marks in the view
- Using Labels in the view
- Area charts are typically used to represent accumulated totals over time and are the conventional way to display stacked lines.
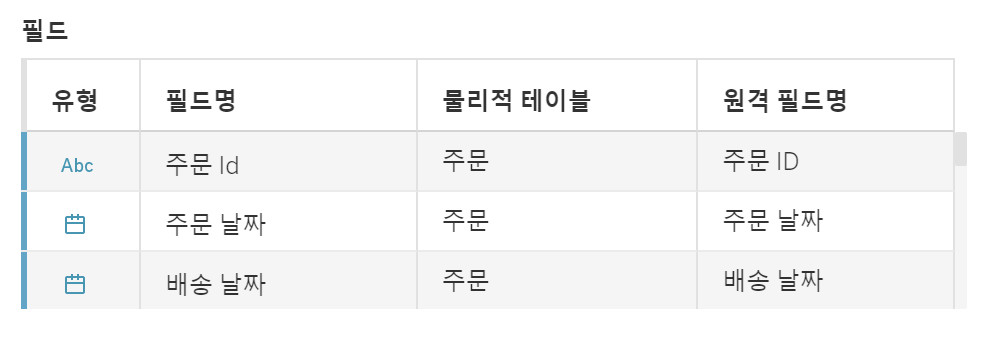
영역형 차트는 일반적으로 시간 경과에 따른 누적 합계를 나타내는 데 사용되며, 일반적으로 쌓인 선을 표시하는 방법입니다. - When using the manage metadata option, we can create custom names for columns where Remote Field Name is the original name of the column whereas Field Name is the custom name we created in Tableau.
메타데이터 관리 옵션을 사용할 때는 열에 대한 사용자 지정 이름을 만들 수 있습니다. 여기서 원격 필드 이름은 열의 원래 이름이고 필드 이름은 Tableau에서 만든 사용자 지정 이름입니다.
- Broadly speaking, when users connect to Tableau, the data fields in their data set are automatically assigned a type and a role.
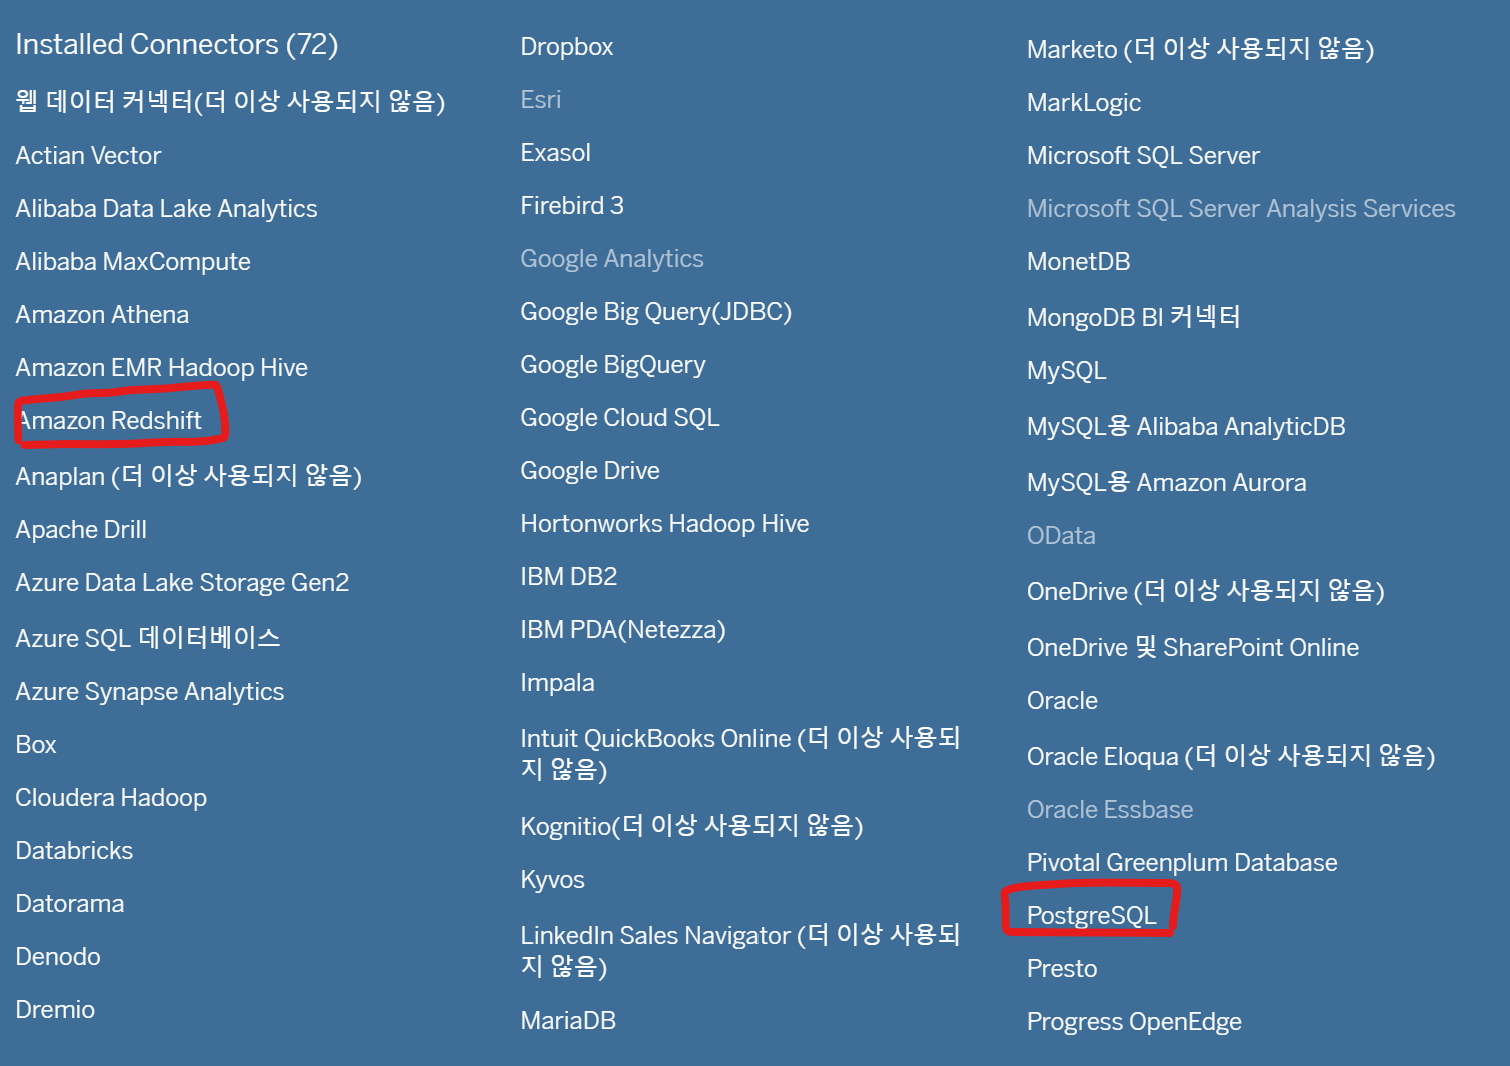
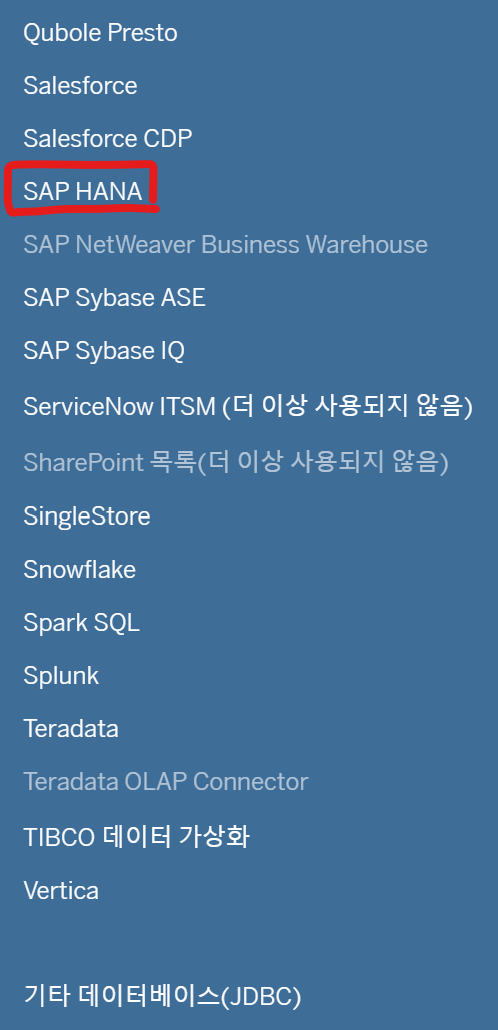
일반적으로 사용자가 Tableau에 연결하면 데이터 세트의 데이터 필드에 유형과 역할이 자동으로 할당됩니다. - Which of the following is not a valid official data source in Tableau Desktop?
다음 중 Tableau Desktop에서 유효한 공식 데이터 소스가 아닌 것은 무엇입니까?
Google Firebase
※ valid official data source: SAP HANA, PostgreSQL, Amazon Redshift
- How can you format numbers in Tableau as currency?
태블로에서 숫자를 통화로 포맷하려면 어떻게 해야 합니까?
Right-click a measure or axis in the view and select Format. Then in the Format pane, click the Numbers drop-down menu.
뷰에서 측정값 또는 축을 마우스 오른쪽 버튼으로 클릭하고 형식을 선택합니다. 그런 다음 형식 창에서 숫자 드롭다운 메뉴를 클릭합니다. - Dragging a Discrete value to color creates distinct colors for each item whereas dragging a Continuous Value to color creates a gradient.
이산 값을 색상으로 끌면 각 항목에 대해 고유한 색상이 생성되는 반면 연속 값을 색상으로 끌면 그라데이션이 생성됩니다. - When creating a dashboard for multiple devices, which of the following Device options are avaliable in the Device Preview section?
여러 장치의 대시보드를 만들 때 장치 미리 보기 섹션에서 사용할 수 있는 장치 옵션은 무엇입니까?
Default, Phone, Tablet, Desktop - For a Manual sort, no matter how the data changes, the values will always stay in the sort order we kept stuff in.
수동 정렬의 경우 데이터가 변경되는 방식에 관계없이 값은 항상 우리가 보관한 정렬 순서대로 유지됩니다. - You may create a context filter to:
- Create a dependent numerical or top N filter
- Improve performance
- Which of the following URL prefixes are permitted when creating a URL Action in Tableau?
다음 중 Tableau에서 URL 작업을 만들 때 허용되는 URL 접두사는 무엇입니까?
HTTPS, HTTP, FTP - .tds are a local copy of a subset or entire data set that you can use to share data with others, when you need to work offline, and improve performance.
.tds는 오프라인으로 작업해야 할 때 다른 사람과 데이터를 공유하고 성능을 향상시키는 데 사용할 수 있는 부분 집합 또는 전체 데이터 세트의 로컬 복사본입니다.
족보 질문: 5, 9, 10
2-1 질문: 17, 31, 37, 40, 45

범주, 하위범주, 제품 이름을 합계(수량)에 따라 내림차순하기
- 범주, 하위범주: ▼ > 필드 > 합계(수량)
- 제품 이름: ▼ > 중첩 > 합계(수량)
Tableau Desktop Specialist Free Practice Exam
Full-length automatically scored free Tableau Desktop Specialist practice exam! Follows the 2022 exam format. No login required.
learningtableau.com
- Which of the following is the best reason to use a live connection instead of an extract?
다음 중 추출 대신 라이브 연결을 사용하는 가장 좋은 이유는 무엇입니까?
➡️ You need to refresh the data as often as possible.
가능한 한 자주 데이터를 새로 고쳐야 합니다. - Which of the following are most likely to reduce the size of an extract?
다음 중 추출물의 크기를 줄일 가능성이 가장 높은 것은 무엇입니까?
- Check the "Aggregate data to visible dimensions" option.
"데이터를 가시적 차원으로 집계" 옵션을 선택합니다. - Select the "Hide All Unused Fields"
사용하지 않는 모든 필드 숨기기를 선택합니다
- Check the "Aggregate data to visible dimensions" option.
- Which file type saves both the connection information (for example the database server address), calculations and groups that you've added, along with an extract of the data?
데이터 추출과 함께 추가한 연결 정보(예: 데이터베이스 서버 주소), 계산 및 그룹을 모두 저장하는 파일 형식은 무엇입니까?
➡️ .tdsx - After adding one table to the canvas, what steps should you follow to create a relationship with a second table located on a different database?
하나의 테이블을 캔버스에 추가한 후 다른 데이터베이스에 있는 두 번째 테이블과 관계를 만들려면 어떤 단계를 수행해야 합니까?
Click the Add link to the right of the Connections heading in the Left pane. Switch between data connections in the Left pane, then drag out the desired table to the canvas and release it.
➡️ 왼쪽 창의 연결 제목 오른쪽에 있는 추가 링크를 클릭합니다. 왼쪽 창에서 데이터 연결을 전환한 다음 원하는 테이블을 캔버스로 끌어다 놓습니다. - A relationship is most similar to which type of join?
관계는 어떤 유형의 조인과 가장 유사합니까?
➡️ Outer - Which of the following can be used to combine tables at different levels of granularity without duplicating data?
다음 중 데이터를 복제하지 않고 다양한 수준의 세분화된 테이블을 결합하는 데 사용할 수 있는 것은 무엇입니까?
➡️ Blend, Relationship - What steps will change "Category" to "Product Category"?
➡️ Right-click the Category pill in the data pane. Select "Rename" then change the text form "Category" to "Product Category"
데이터 창에서 Category(카테고리) 알약을 클릭합니다. "이름 바꾸기"를 선택한 후 "카테고리" 텍스트 양식을 "제품 카테고리"로 변경합니다 - Which fields shown in the data pane below, when included in a map, will cause the system generated latitude and longitude fields to be added to the view?
아래 데이터 창에 표시된 필드는 지도에 포함되어 있을 때 시스템에서 생성한 위도 및 경도 필드가 보기에 추가되도록 합니까?
➡️ State, City, Country/Region - Default formatting can be set for which of the following.
다음 중 어느 것에 대한 기본 형식을 설정할 수 있습니다.
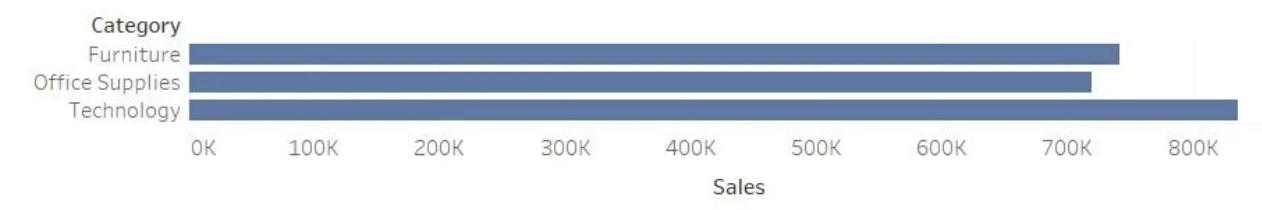
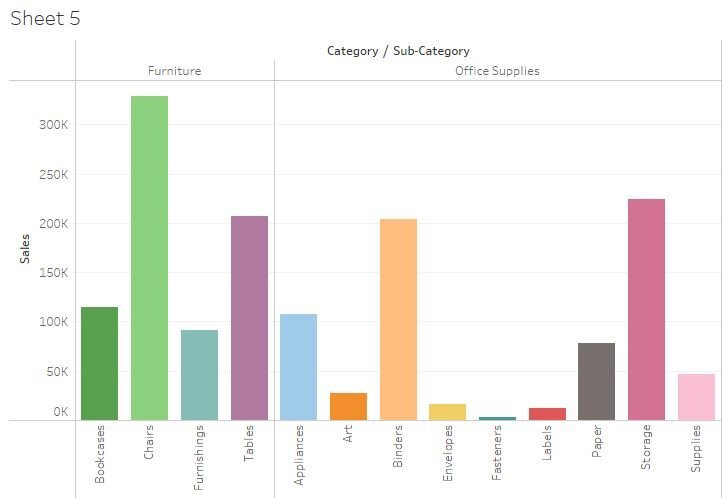
➡️ Numbers, Dates - What steps should you take to create this bar chart?
이 막대 차트를 만들려면 어떤 단계를 수행해야 합니까?
➡️ Drag the Sales pill to the Column Shelf and the Category pill to the Row Shelf.
Sales 알약을 열 선반으로, Category 알약을 행 선반으로 끕니다.
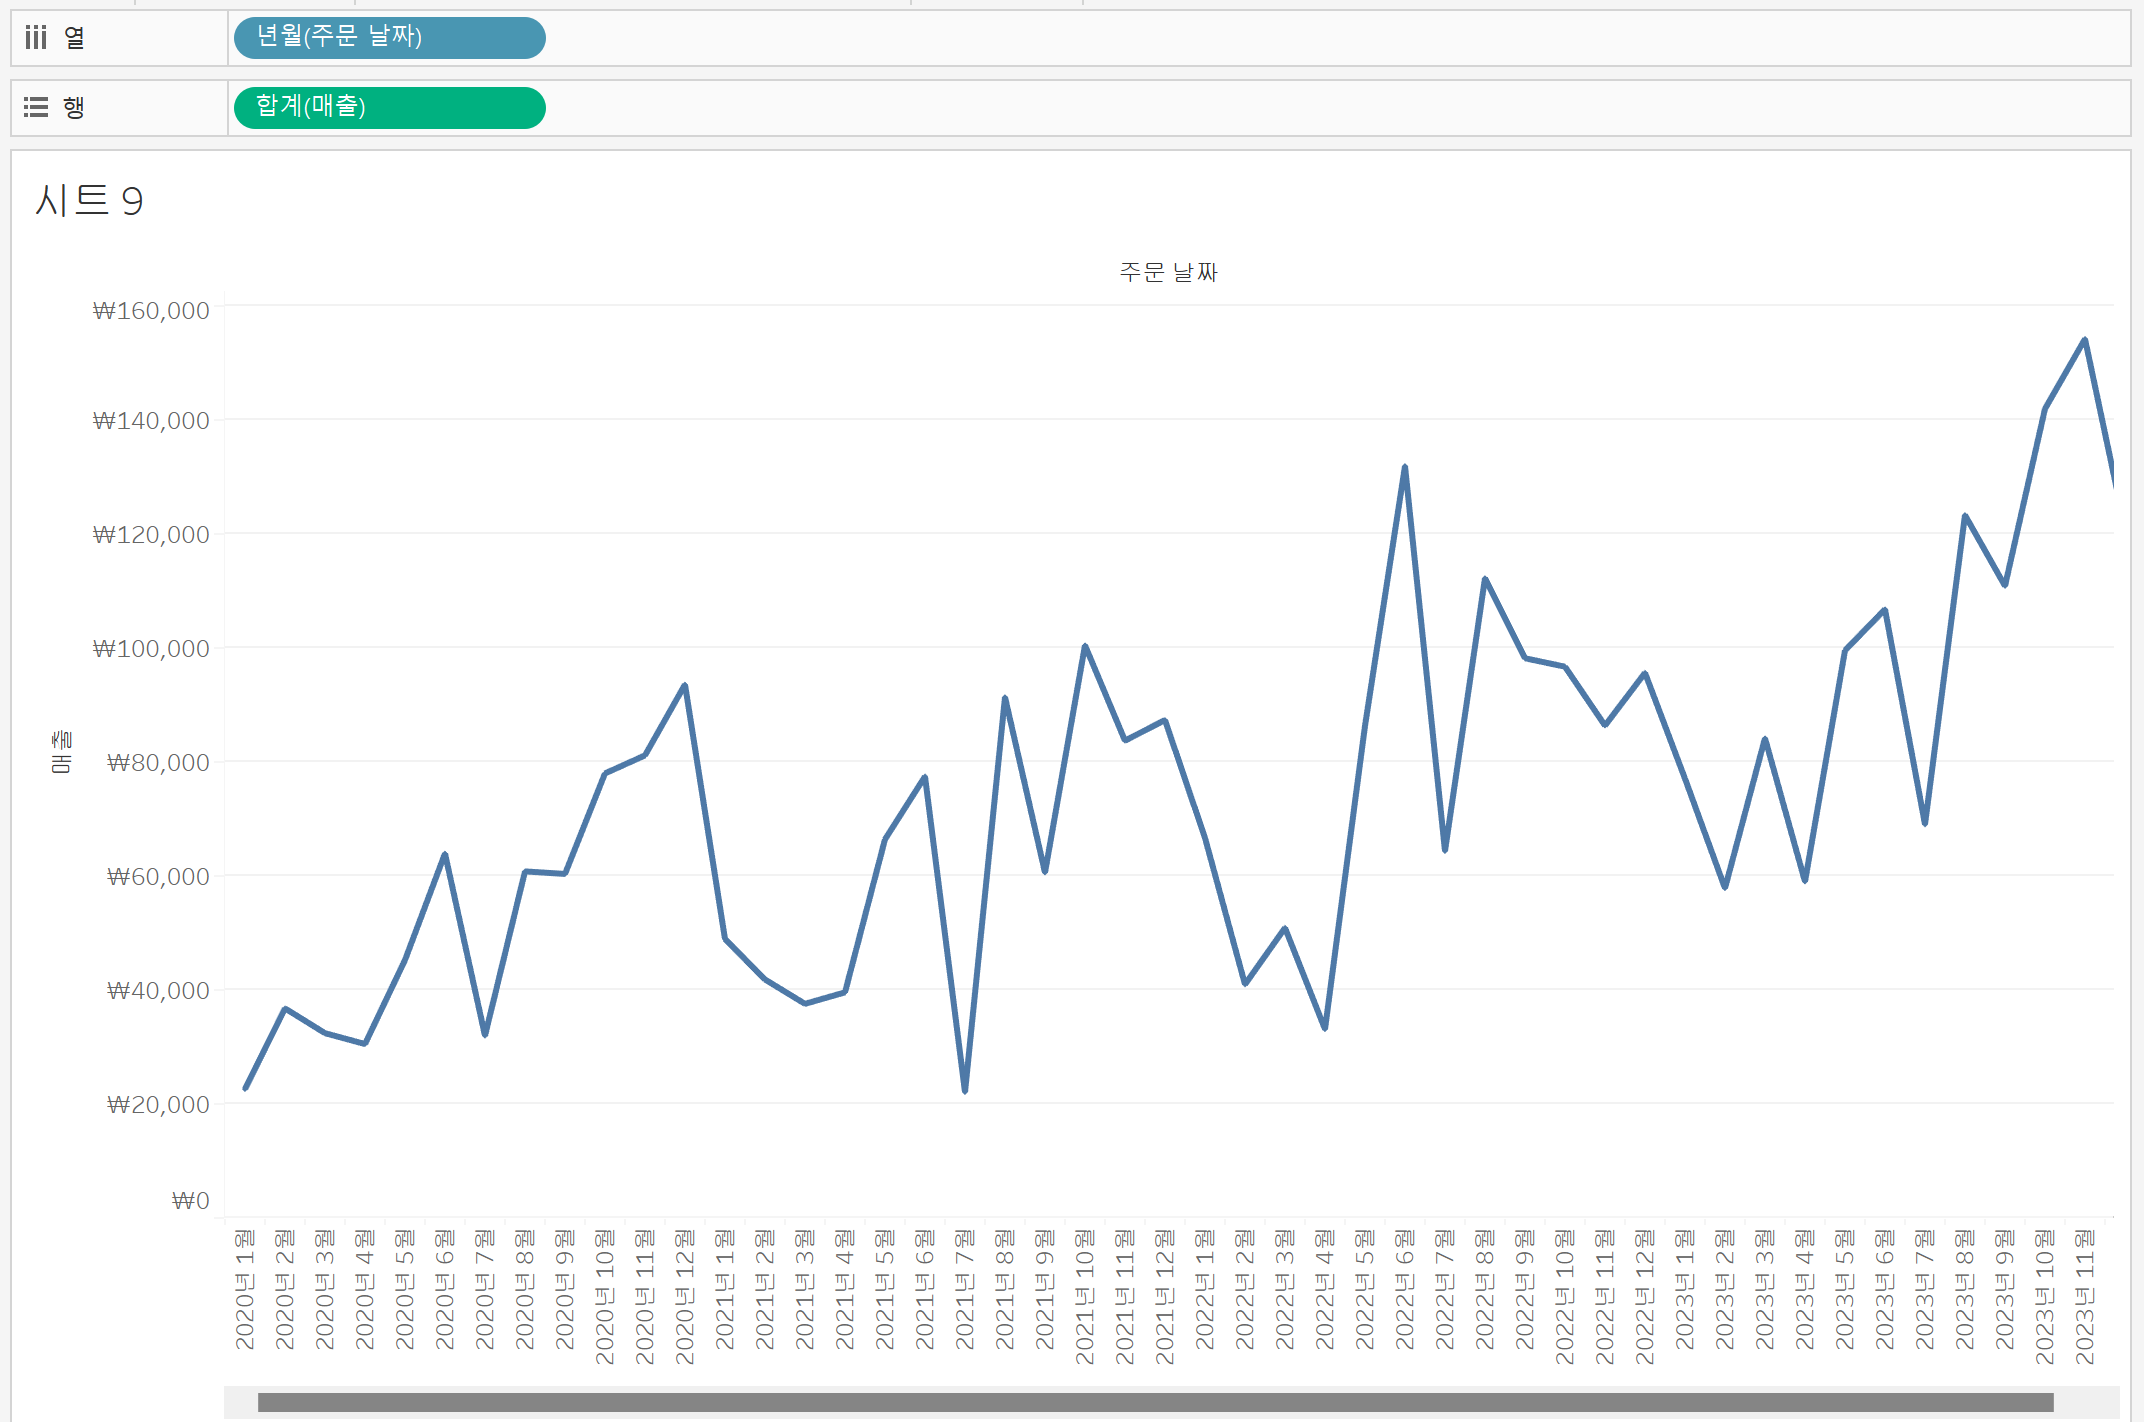
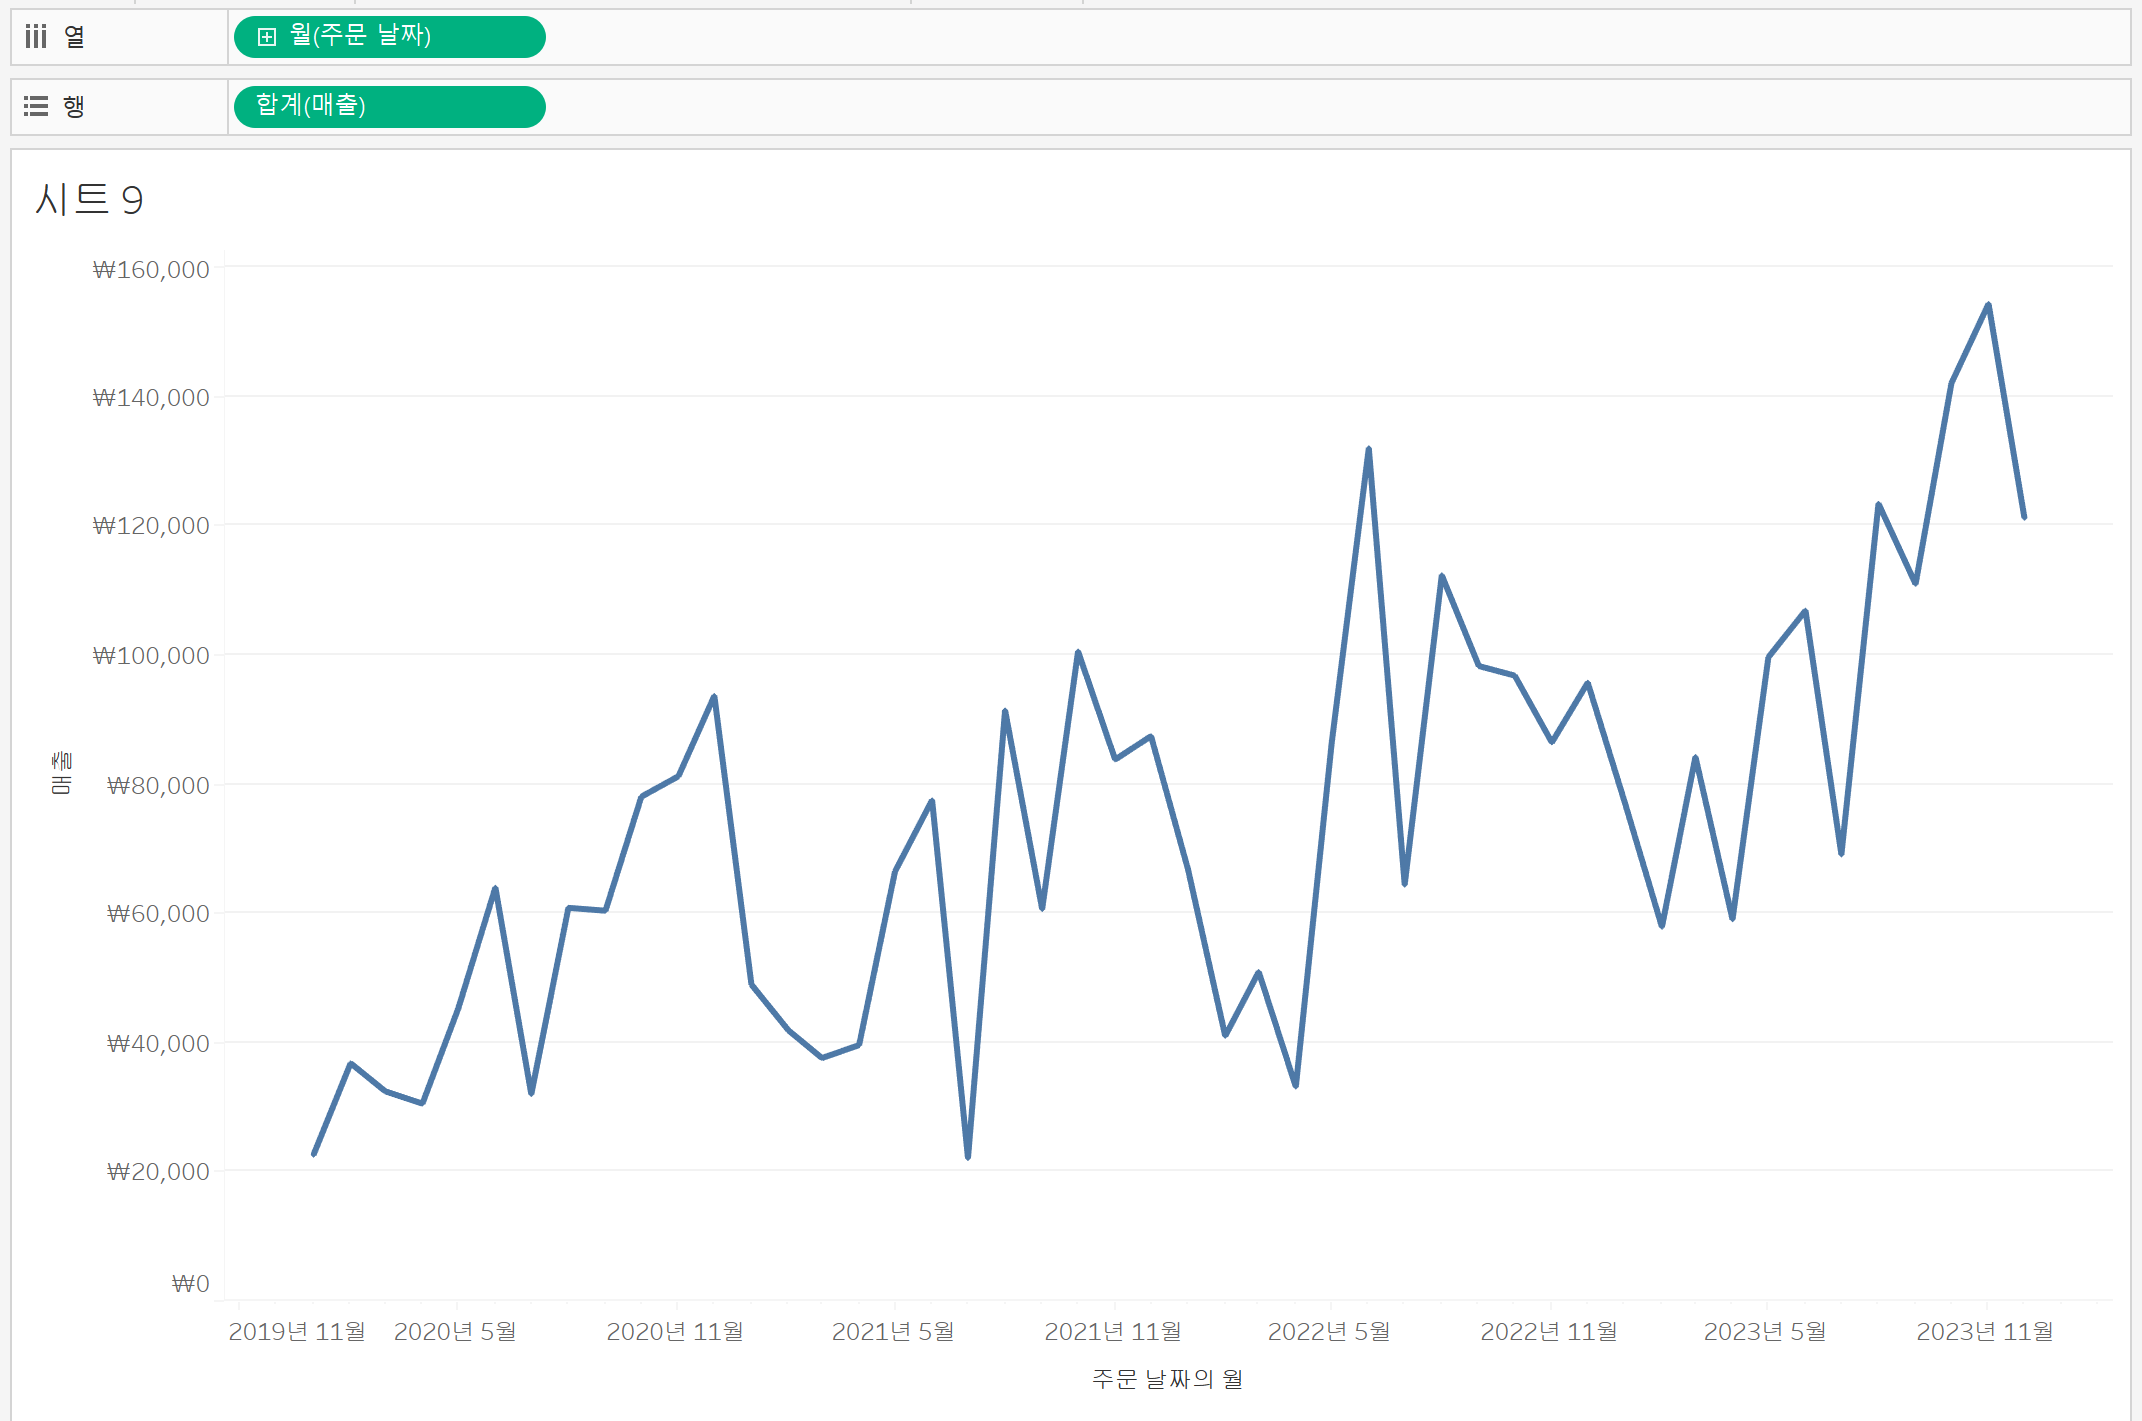
- Which type of date field is used below?
아래에서 사용되는 날짜 필드 유형은 무엇입니까?
➡️ Discrete (이산형)
- Which type of chart would be most appropriate for showing the relationship between two measures?
두 측정값 사이의 관계를 보여주는 데 가장 적합한 차트 유형은 무엇입니까?
➡️ Scatter Chart - You have a bar chart showing monthly revenue by store. What should you do to combine the bars for two of the stores?
스토어별 월별 매출을 보여주는 막대 차트가 있습니다. 두 가게의 바를 결합하려면 어떻게 해야 합니까?
➡️ Create a group
- You have created a polygon map and would like to be able to see all major cities shown on the map. How should you show these?
다각형 지도를 작성했으며 지도에 표시된 모든 주요 도시를 볼 수 있습니다. 이거 어떻게 보여줘야 돼요?
➡️ On the toolbar, select Map and then Map Layers. Check the box next to Cities in the Map Layer pane.
도구 모음에서 지도를 선택한 다음 도면층 매핑을 선택합니다. 지도 계층 창의 도시 옆에 있는 상자를 선택합니다. - You have a scatter plot that uses different symbols to represent different product sub-categories. What steps should you take to replace the symbol for Bookcases with a square?
서로 다른 제품 하위 범주를 나타내기 위해 서로 다른 기호를 사용하는 산점도가 있습니다. 북케이스 기호를 사각형으로 대체하려면 어떤 단계를 수행해야 합니까?- Click the Shapes mark, then select bookcases and the square shape. Click Okay.
도형 표시를 클릭한 다음 책장과 정사각형 모양을 선택합니다. 확인을 클릭합니다. - In the data pane, select default properties then Shape. In the menu that appears, select bookcases and the square shape. Click Okay.
데이터 창에서 기본 특성을 선택한 다음 모양을 선택합니다. 메뉴가 나타나면 책장과 정사각형 모양을 선택합니다. 확인을 클릭합니다.
- Click the Shapes mark, then select bookcases and the square shape. Click Okay.

- You wish to organize related dimensions into a series of different levels. Which feature should you use?
관련 차원을 일련의 서로 다른 수준으로 구성하려고 합니다. 어떤 기능을 사용해야 합니까?
➡️ Hierarchy - Which of the following describe the steps needed to do a manual sort?
다음 중 수동 정렬에 필요한 단계를 설명하는 것은 무엇입니까?- Right-click the pill for the dimension you'd like to sort. Select Sort, then Manual. Use the arrows to manually sort and click okay.
정렬할 차원의 알약을 마우스 오른쪽 버튼으로 클릭합니다. 정렬을 선택한 다음 수동을 선택합니다. 화살표를 사용하여 수동으로 정렬하고 확인을 클릭합니다. - Click a header and drag it to the new location.
머리글을 클릭하고 새 위치로 끕니다.
- Right-click the pill for the dimension you'd like to sort. Select Sort, then Manual. Use the arrows to manually sort and click okay.
- You have a line chart showing total sales by year. How can you change this to a bar chart?
연도별 총 매출을 보여주는 선 차트가 있습니다. 어떻게 이것을 막대 차트로 바꿀 수 있습니까?
- On the Marks card, select Bar from the drop-down list.
Marks(표시) 카드의 드롭다운 목록에서 Bar(바)를 선택합니다. - On the Show Me menu, select horizontal bars.
표시 메뉴에서 가로 막대를 선택합니다
- On the Marks card, select Bar from the drop-down list.
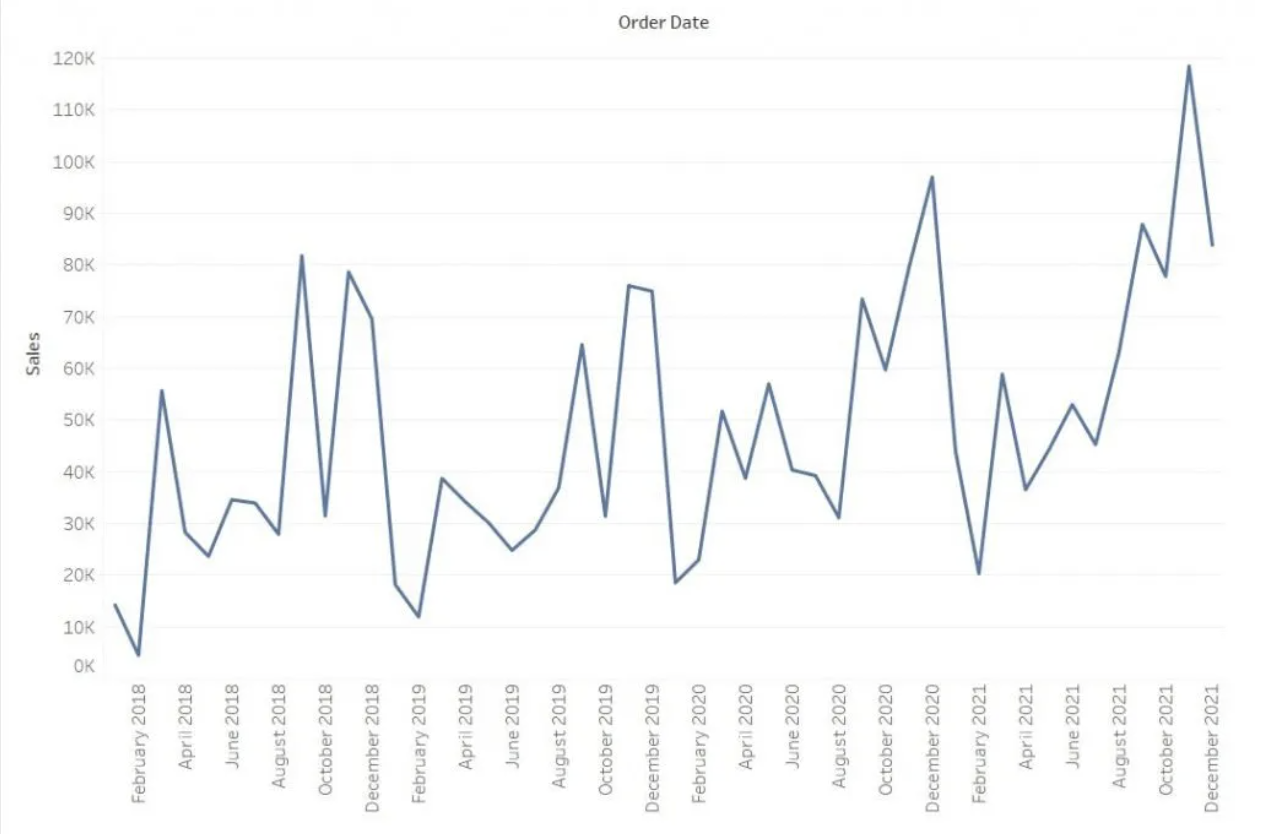
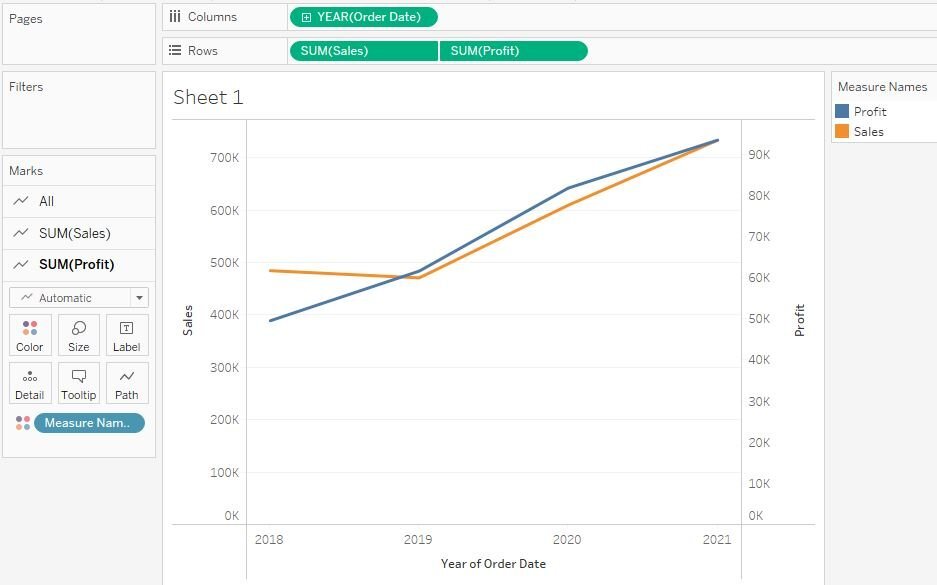
- Which best describes this chart?
이 차트를 가장 잘 설명하는 것은 무엇입니까?
➡️ A dual axis chart with axes that are not synchronized
동기화되지 않은 축이 있는 이중 축 차트
- You have a crosstab view showing the average listing prices for homes by zipcode. What would be the best way to update the view to remove zip-codes with average listing prices about 300,000?
우편 번호별 주택의 평균 상장 가격을 보여주는 교차 탭 보기가 있습니다. 평균 상장 가격이 약 300,000인 우편 번호를 제거하기 위해 보기를 업데이트하는 가장 좋은 방법은 무엇입니까?
➡️ Add a measure filter on the listing price
리스트 가격에 측정 필터 추가 - Your workbook has two different data sources, both sharing a field called "Business Name." How can a single filter be used to filter both data sources on this field?
워크북에는 두 개의 서로 다른 데이터 원본이 있으며, 둘 다 "사업자 이름"이라는 필드를 공유합니다 이 필드의 두 데이터 소스를 필터링하는데 단일 필터를 어떻게 사용할 수 있습니까?
➡️ Select the "All using this data source" option for the filter
필터에 대해 "이 데이터 원본을 사용하는 모든" 옵션을 선택합니다. - What steps should you take to place a filter on an Order Date field so that one of the worksheets in the workbook shows only orders placed in the current month when the viz is opened?
주문 날짜 필드에 필터를 배치하여 워크북의 워크시트 중 하나에 viz가 열려 있는 현재 달의 주문만 표시되도록 하려면 어떤 단계를 수행해야 합니까?
➡️ Drag the date field to the filters area. Select Relative Dates. Then select Months and This Month.
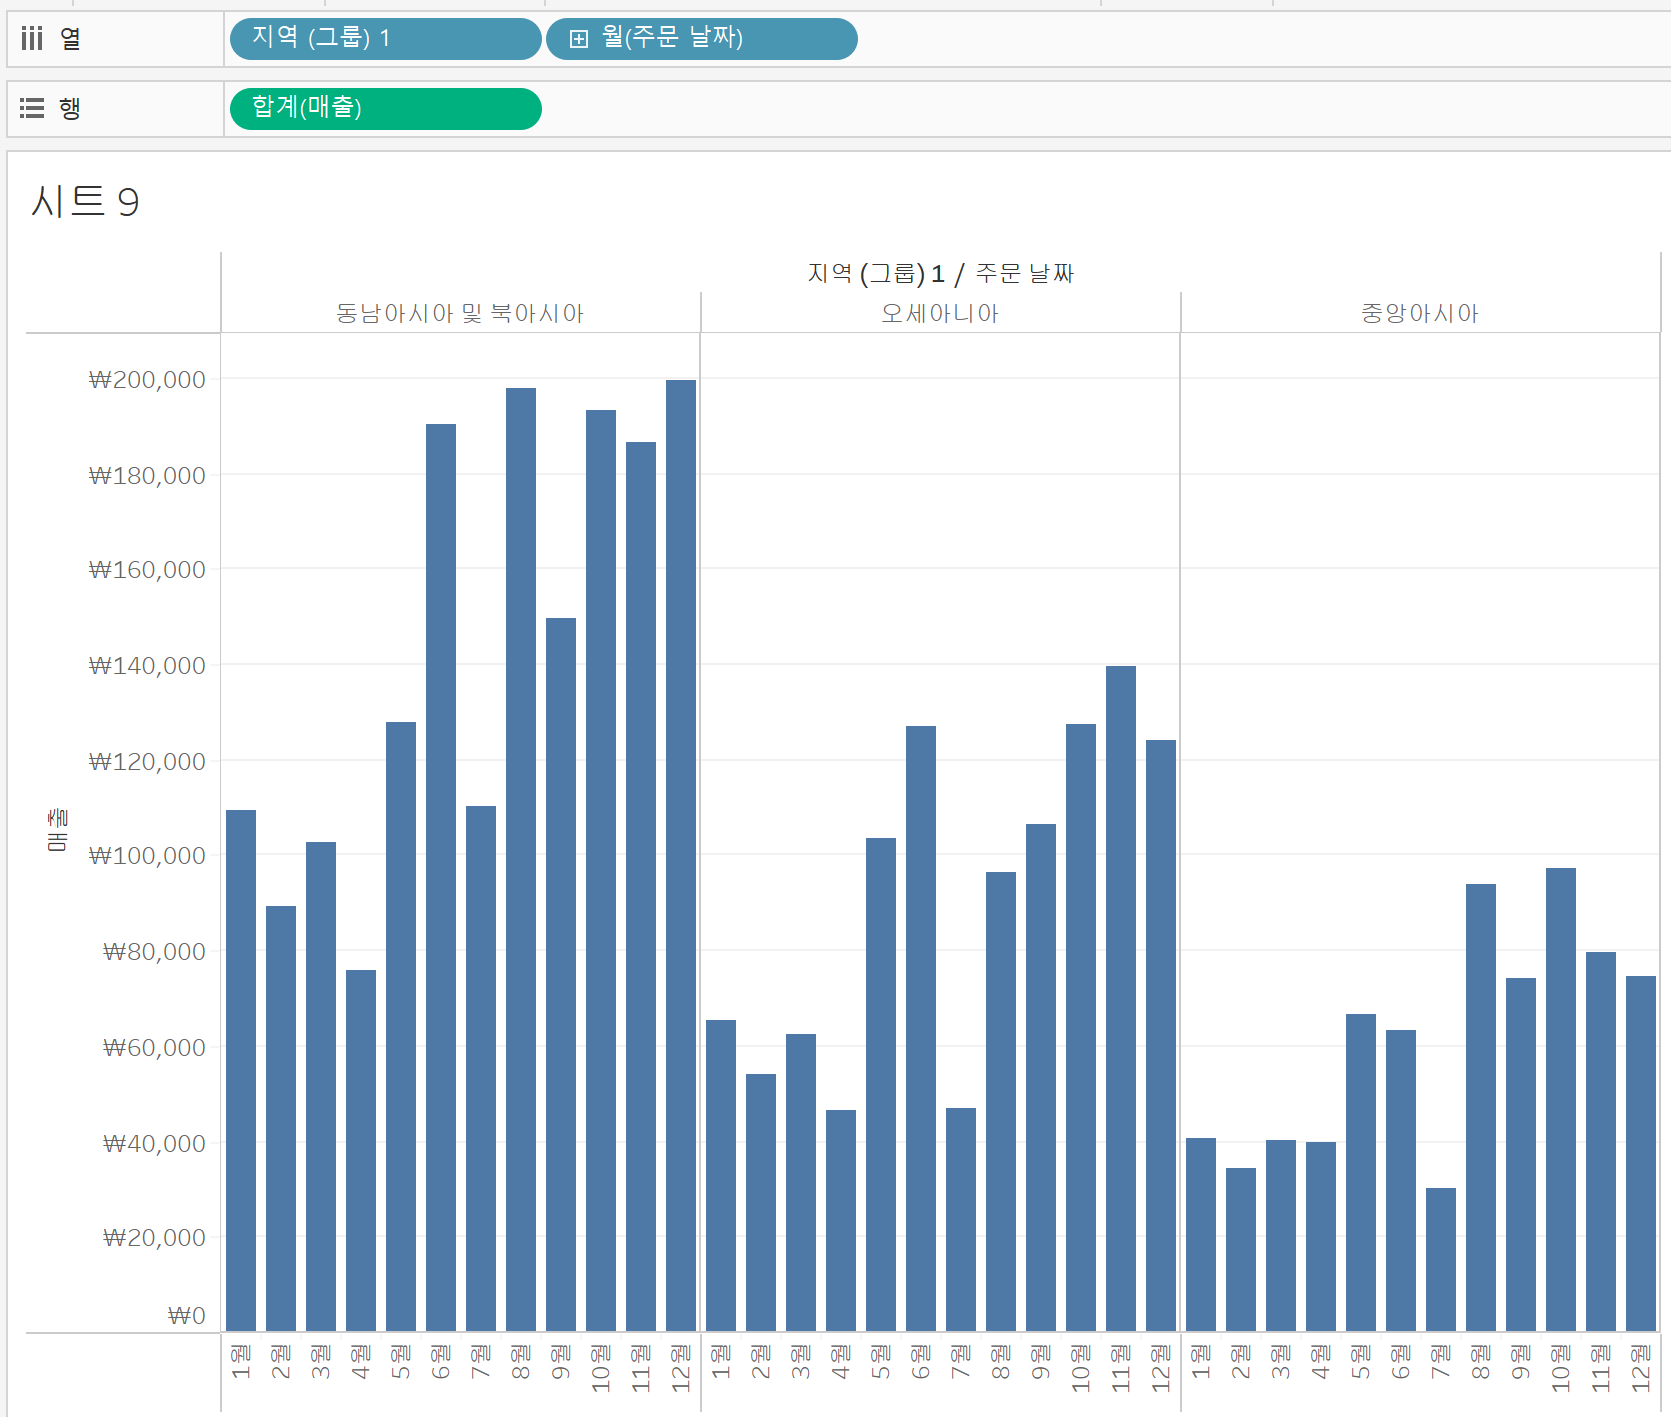
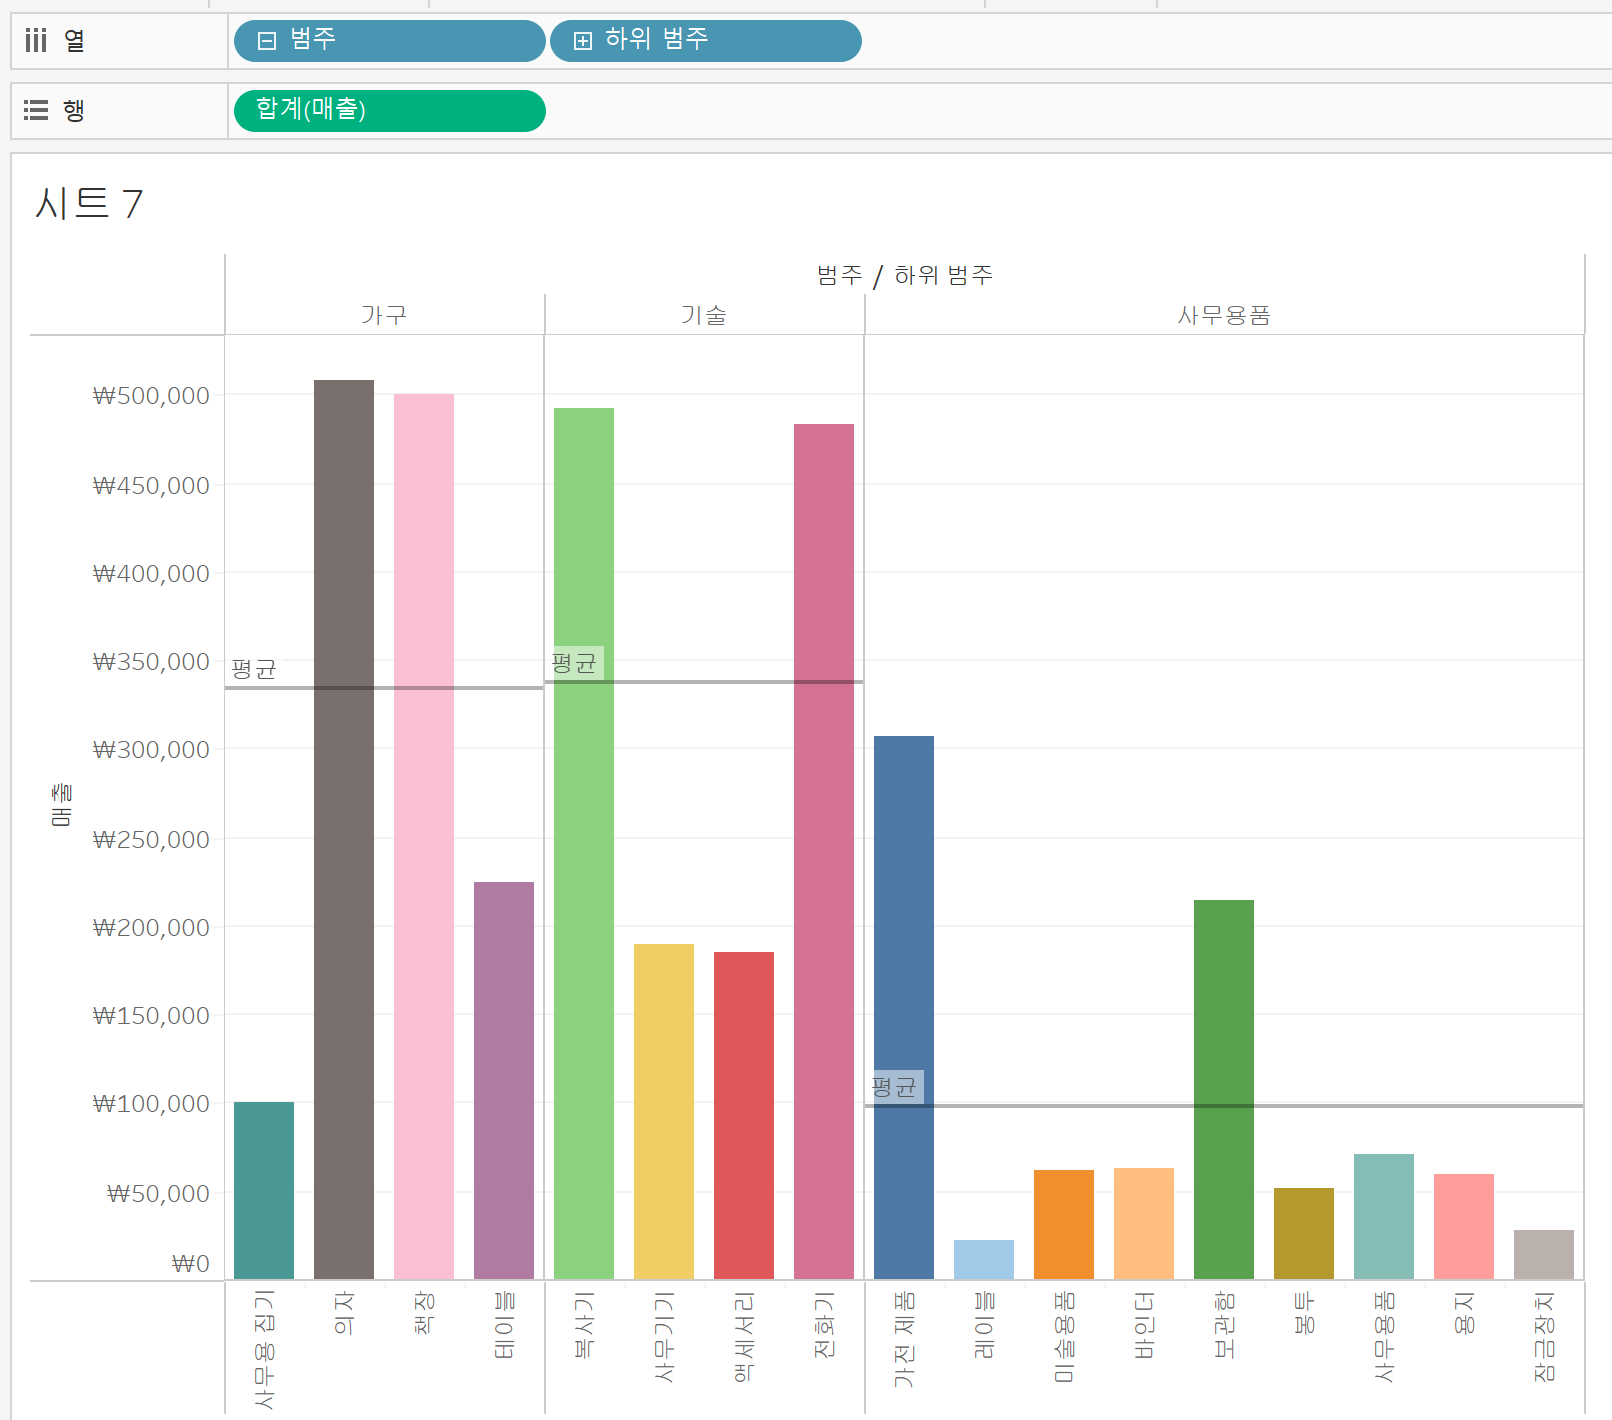
날짜 필드를 필터 영역으로 끕니다. 상대 날짜를 선택합니다. 그런 다음 월과 이번 달을 선택합니다. - What reference line options should you use so that the showing the average sum of sales per sub-category for each category?
각 범주에 대한 하위 범주별 평균 매출 합계를 표시하려면 어떤 기준선 옵션을 사용해야 합니까?
➡️ Set the scope to be "Per Pane" and the Value to be SUM(Sales) using Average
평균을 사용하여 범위를 "Per Pane"으로 설정하고 값을 SUM(판매)으로 설정합니다
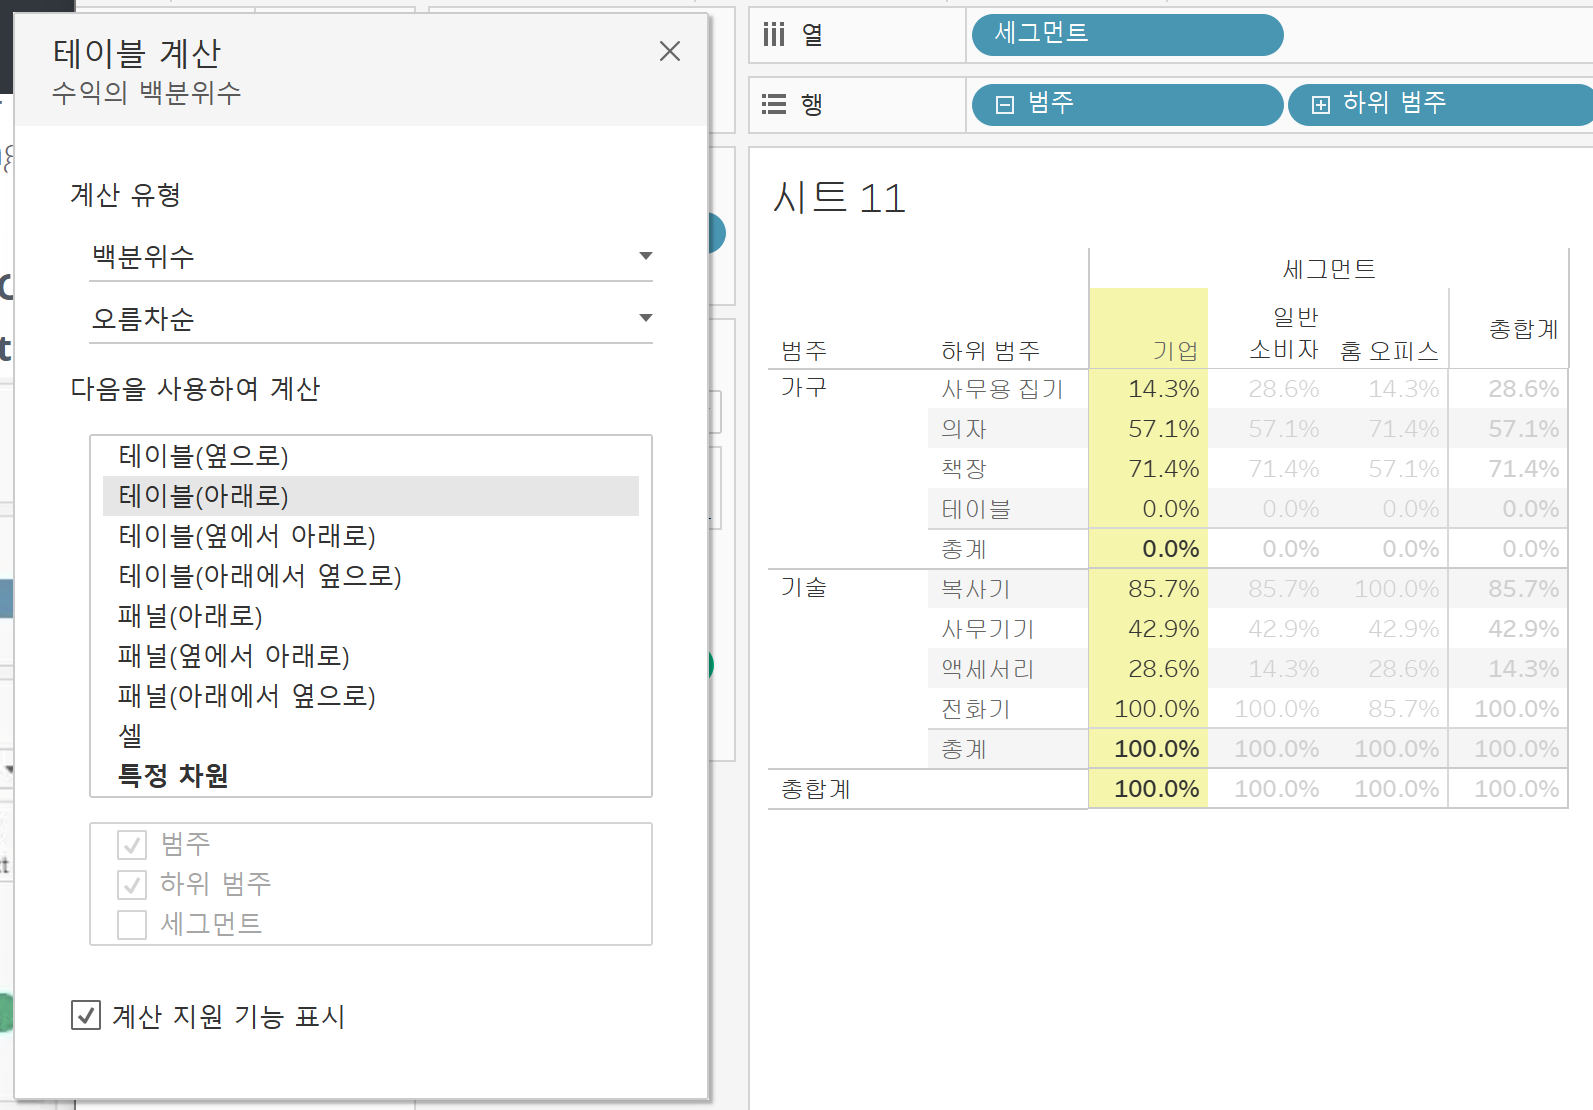
- Which "Compute Using" option is being used in the "Percent of total" calculation shown below?
아래 표시된 "전체 비율" 계산에 사용되는 "컴퓨팅 사용" 옵션은 무엇입니까?
➡️ Pane (down)

- Which of the following chart types is most likely to include a bin?
다음 중 빈을 포함할 가능성이 가장 높은 차트 유형은 무엇입니까?
➡️ Histogram - Which calculation will add the Tax field to the Sales Price field?
판매 가격 필드에 세금 필드가 추가되는 계산은 무엇입니까?
➡️ [Tax] + [Sales Price] - How can totals be added to crosstab view?
총계를 교차 탭 보기에 추가하려면 어떻게 해야 합니까?
- Select the Analytics Pane. Drag totals into the view. Release the mouse on the type of total you'd like to add.
분석 창을 선택합니다. 합계를 보기로 끕니다. 추가할 합계 유형에서 마우스를 놓습니다. - On the Analysis tab of the toolbar, select Totals. Then select the type of total you'd like to add.
도구 모음의 분석 탭에서 합계를 선택합니다. 그런 다음 추가할 합계 유형을 선택합니다.
- Select the Analytics Pane. Drag totals into the view. Release the mouse on the type of total you'd like to add.
- You have a scatter plots of products with Sales on the X-axis and Profit on the Y-axis. What should you do so that the points on the plot are larger depending on the total quantity sold?
X 축에는 판매가 있고 Y 축에는 이익이 있는 제품의 산점도가 있습니다. 총 판매 수량에 따라 그래프의 점이 커지도록 하려면 어떻게 해야 합니까?
- Drag the pill for the Quantity Sold field to the Size card.
Quantity Sold(판매 수량) 필드의 알약을 Size(크기) 카드로 끕니다. - Drag the pill for Quanitity Sold field into the center of the chart and release the mouse.
Quanitity Sold에 대한 알약 필드를 차트의 중앙으로 끌어다 놓고 마우스를 놓습니다
- Drag the pill for the Quantity Sold field to the Size card.
- You've created a bar chart showing Sales by Category, but you'd like the user to be able to choose to have other measures shown in the same format. How could this be achieved?
범주별 판매를 표시하는 막대 차트를 만들었지만 사용자가 동일한 형식으로 다른 측정값을 표시하도록 선택할 수 있습니다. 어떻게 이를 달성할 수 있습니까?
➡️ With a parameter - Which interactive elements can you add to a dashboard?
대시보드에 추가할 수 있는 대화형 요소는 무엇입니까?
➡️ URL Actions, Highlight Actions, Filter Actions - You'd like to add the same worksheet multiple times, but with different filters selected. Which feature will support this?
다른 필터를 선택한 상태에서 동일한 워크시트를 여러 번 추가하려고 합니다. 이를 지원하는 기능은 무엇입니까?
➡️ Stories Only - Which option creates a dashboard action?
대시보드 작업을 생성하는 옵션은 무엇입니까?
➡️ Use as Filter - Which of the following describes the relationship between the default dashboard layout and device-specific layouts?
다음 중 기본 대시보드 레이아웃과 장치별 레이아웃 간의 관계를 설명하는 것은 무엇입니까?
- Items on the default dashboard layout need not be included on the device-specific layouts.
기본 대시보드 레이아웃의 항목은 장치별 레이아웃에 포함할 필요가 없습니다. - Items on the device-specific layouts must also be present on the default layout
장치별 레이아웃의 항목도 기본 레이아웃에 있어야 합니다.
- Items on the default dashboard layout need not be included on the device-specific layouts.
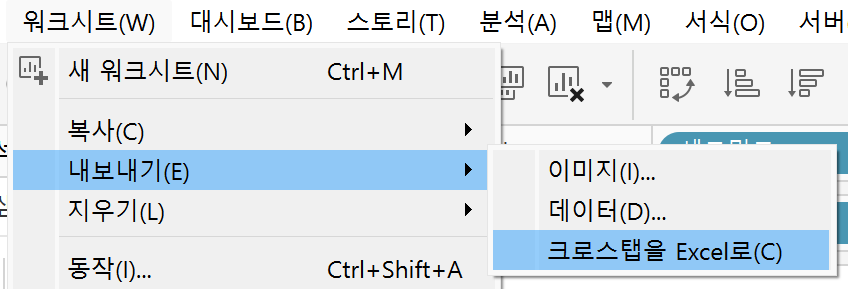
- You've created a crosstab view with dimensions and an aggregated measure. What steps should you take to export the crosstab to Excel?
치수 및 집계 측도를 사용하여 교차 탭 뷰를 작성했습니다. 크로스 탭을 Excel로 내보내려면 어떤 조치를 취해야 합니까?
➡️ Select Worksheet > Export > Crosstab to Excel
워크시트 > 내보내기 > Excel로 교차 탭 선택
- Which toolbar icon starts the process of publishing the workbook to server?

워크북을 서버에 게시하는 프로세스를 시작하는 도구 모음 아이콘은 무엇입니까? - Which of the following would most likely be a measure?
다음 중 측정값로 가장 가능성이 높은 것은 무엇입니까?
➡️ Sales tax - Which of the following will create an axes when it is added to the row or column shelf?
다음 중 행 또는 열 선반에 추가할 때 축이 생성되는 것은 무엇입니까?
➡️ A continuous measure / dimension
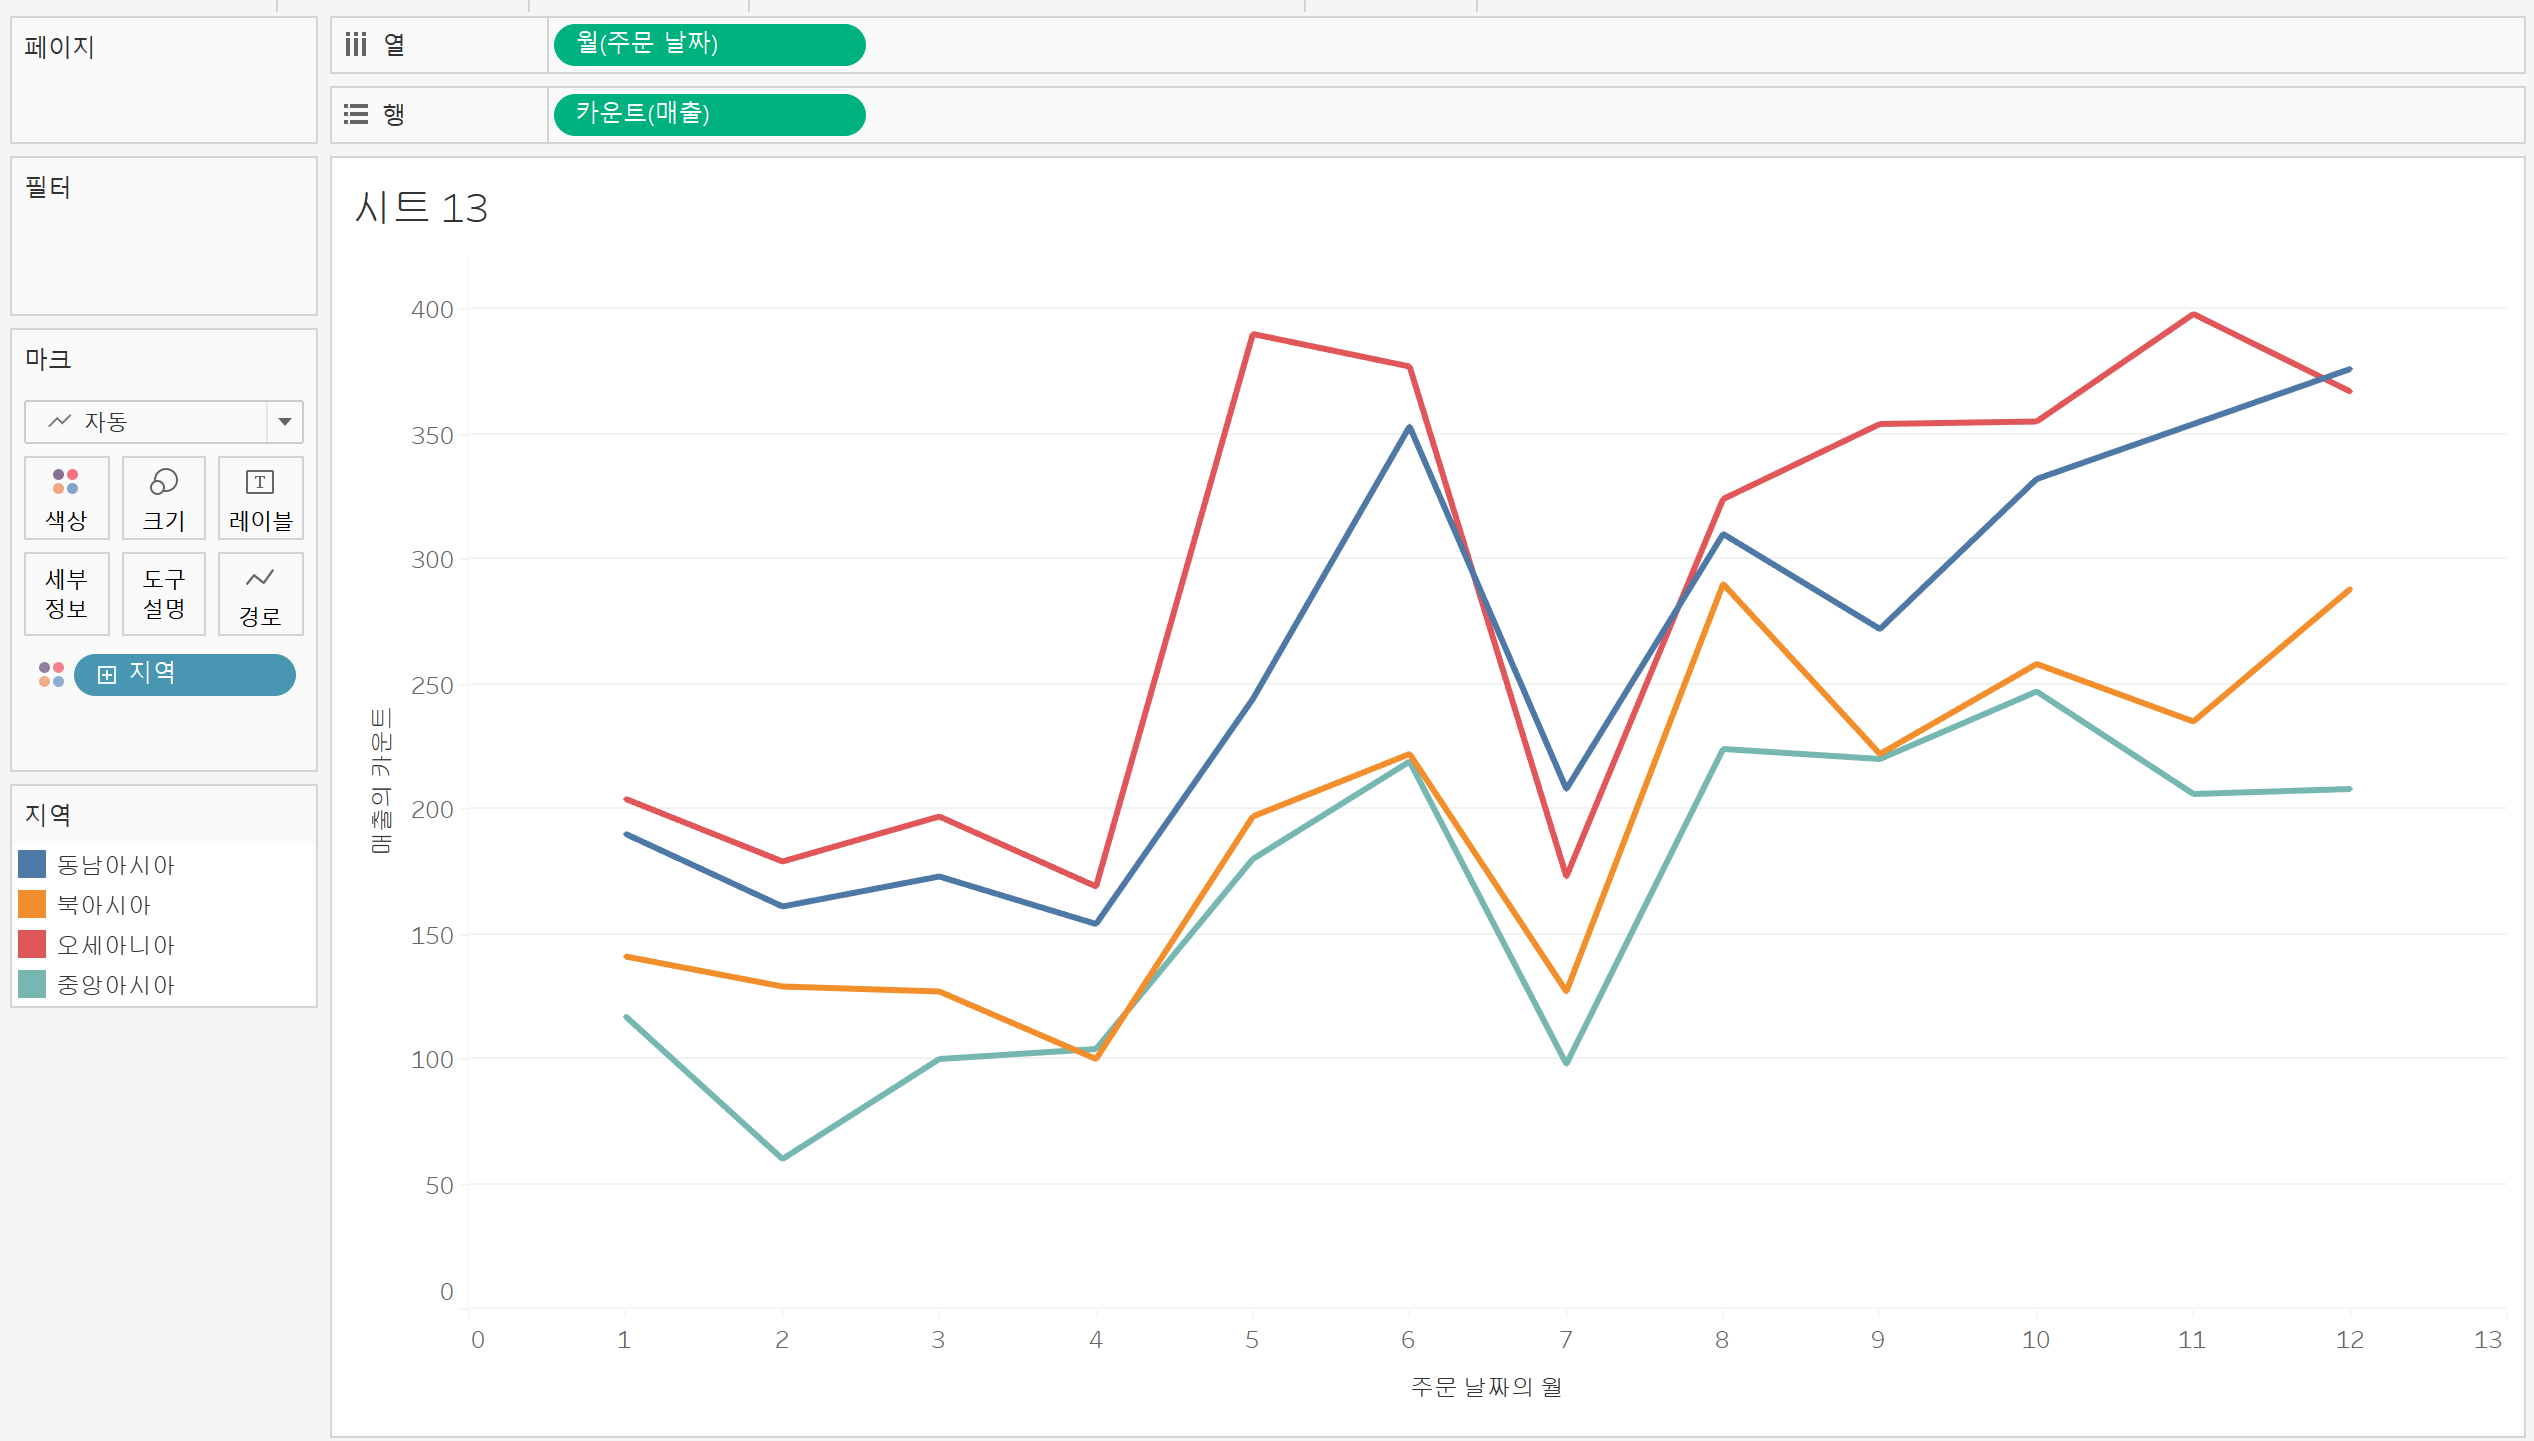
연속 측정 / 차원 - You have a line chart showing the number of motor vehicle accidents per month. You drag the "accident type" dimension to the color measure. How does this change the line chart?
한 달에 발생한 자동차 사고의 수를 보여주는 꺽은선형 차트가 있습니다. 사고 유형 치수를 색상 측도로 끕니다. 이것은 어떻게 선 차트를 변경합니까?
➡️ The number of lines on the chart will increase. The heights of the lines will decrease.
차트의 줄 수가 증가합니다. 선의 높이가 감소합니다.

점심시간을 일찍 가져서 그런건지, 비가와서 그런건지 오후에 유독 피곤했다🥲
그래도 (아주 완만하게) 좋아지는 성적을 보니 동기부여가 된다 💪
맛있는 저녁을 먹고 힘을 내서 오늘도 저녁공부까지 완료!!!
태블로 자격증 기다려랏
* 유데미 큐레이션 바로가기 : https://bit.ly/3HRWeVL
* STARTERS 취업 부트캠프 공식 블로그 : https://blog.naver.com/udemy-wjtb
📌 본 후기는 유데미-웅진씽크빅 취업 부트캠프 4기 데이터분석/시각화 학습 일지 리뷰로 작성되었습니다.
728x90
'교육 > 유데미 스타터스 4기' 카테고리의 다른 글
| 유데미 스타터스 취업 부트캠프 4기 - 데이터분석/시각화(태블로) 9주차 학습 일지 (0) | 2023.04.07 |
|---|---|
| [👩💻TIL 44일차 ] 유데미 스타터스 취업 부트캠프 4기 (0) | 2023.04.07 |
| [👩💻TIL 42일차 ] 유데미 스타터스 취업 부트캠프 4기 (0) | 2023.04.05 |
| [👩💻TIL 41일차 ] 유데미 스타터스 취업 부트캠프 4기 (1) | 2023.04.04 |
| [👩💻TIL 40일차 ] 유데미 스타터스 취업 부트캠프 4기 (0) | 2023.04.03 |
'교육/유데미 스타터스 4기' Related Articles
more


Comments